cultural activities
11
finnish cultural foundation
annual report 2013–2014
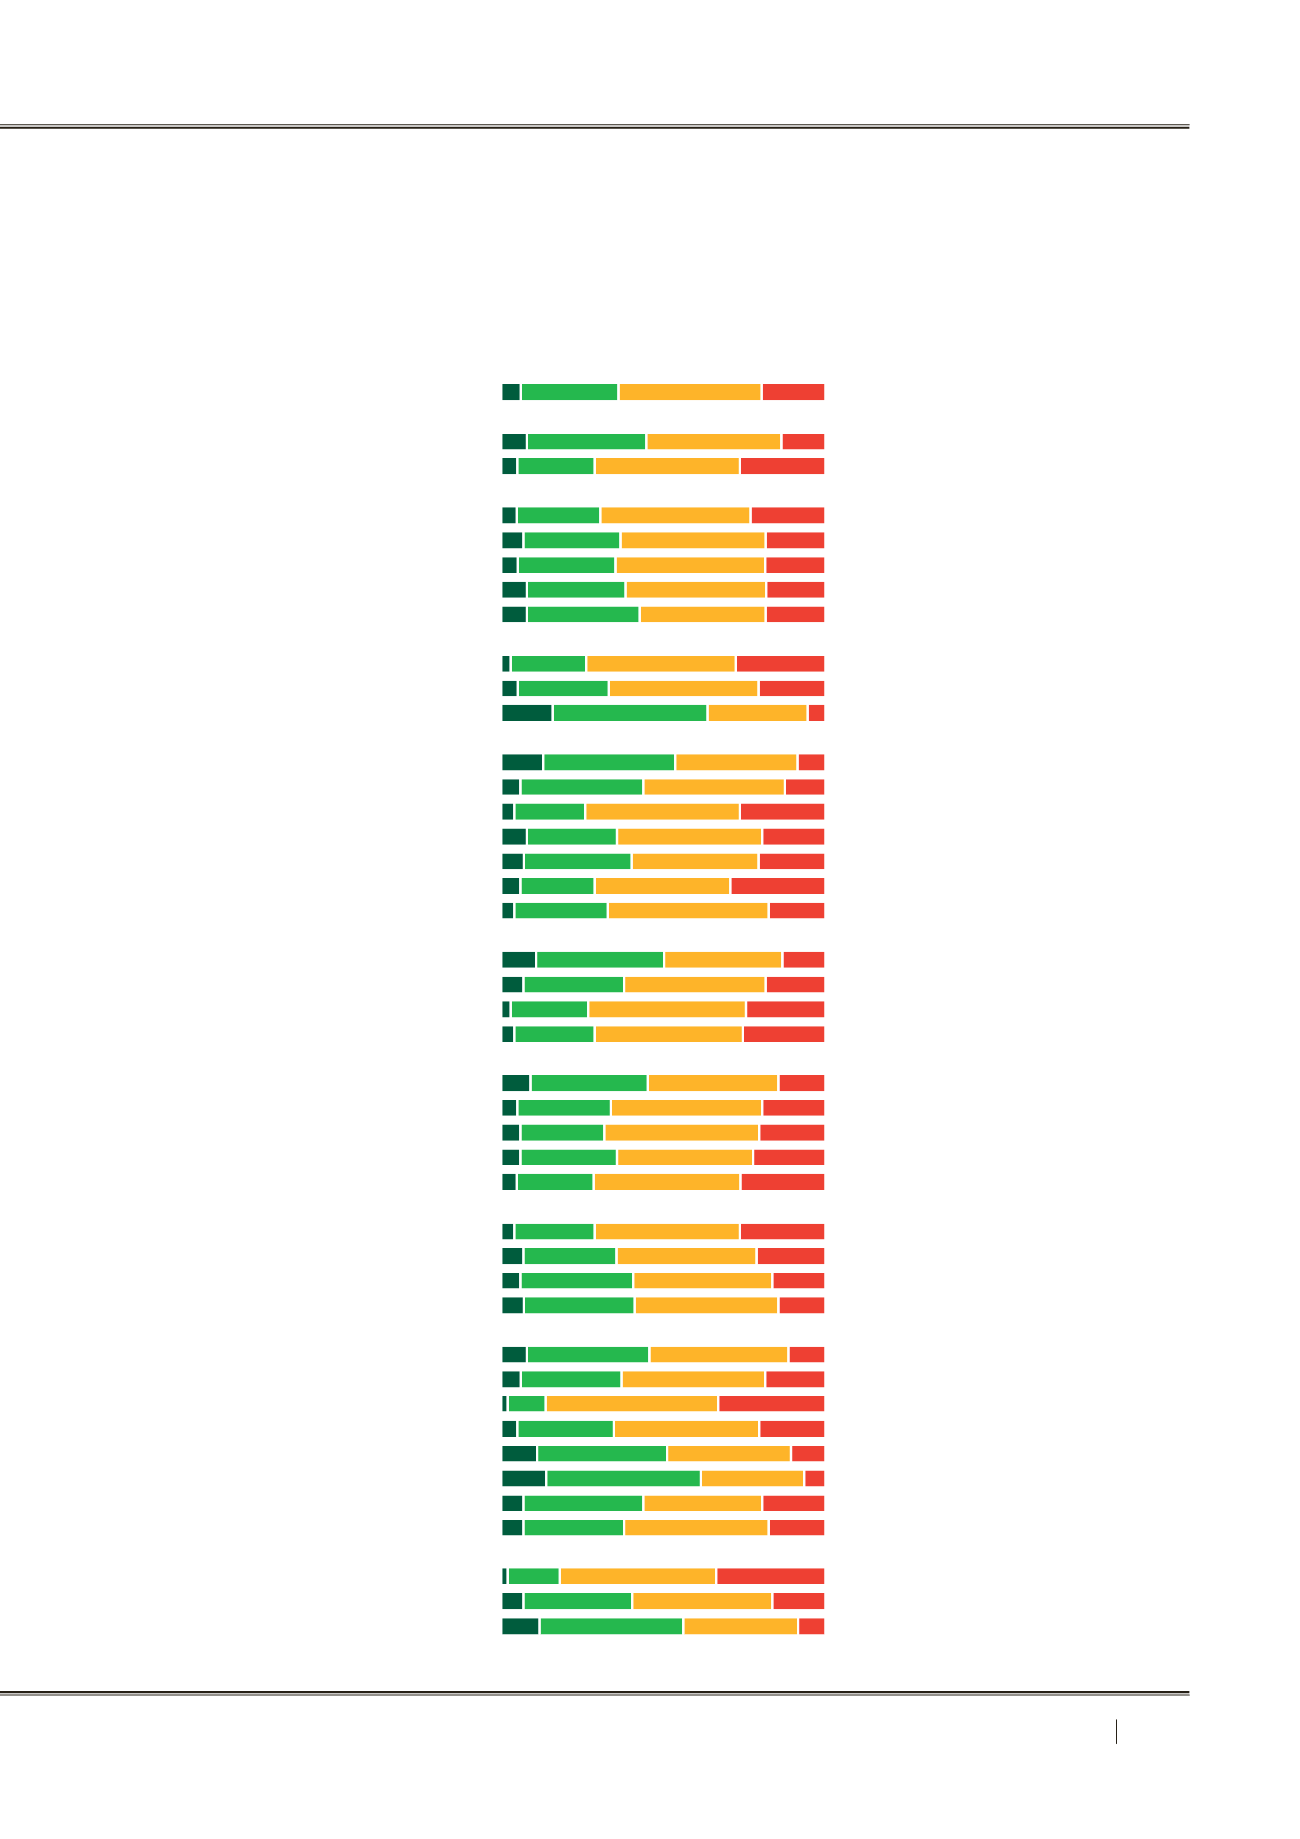
All
Female Male
Aged under 31
Aged 31–39
Aged 40–49
Aged 50–59
Aged over 59
Basic education
Other education
Academic
Director/senior salaried employee
Salaried employee
Blue-collar worker
Entrepreneur
Pensioner
Unemployed Student
Helsinki Region
Other town or city
Rural area
Semiurban area
Uusimaa
Southern Finland
Eastern Finland
Western Finland
Northern Finland
Income below EUR 25,000
25,000–45,000
45,000–55,000
Income over EUR 55,000
Conservative Party
Social Democrats
Finns Party
Centre Party Greens
Left Alliance
Other total
Can’t say
Working class
Lower middle class
Upper middle class
6 30 44 19
8 37 42 13
5 24 45 26
5 26 47 23
7 30 45 18
5 30 46 18
8 31 44 18
8 35 39 18
3 23 46 27
5 28 46 20
16 48 31 5
13 41 38 8
6 38 44 12
4 22 48 26
8 28 45 19
7 33 39 20
6 23 42 29
4 29 50 17
11 40 37 13
7 31 44 18
3 24 49 24
4 25 46 25
9 36 40 14
5 29 47 19
6 26 48 20
6 30 42 22
5 24 46 26
4 25 45 26
7 29 44 21
6 35 43 16
7 34 44 14
8 38 43 11
6 31 44 18
2 12 54 33
5 30 45 20
11 40 38 10
14 48 32 6
7 37 37 19
7 31 45 17
2 16 48 33
7 34 44 16
12 45 36 8
Consumers of culture
Active consumers
❶
Active but selective consumers
❷
❸
Consumers of culture who are passive and selective
❹
Passive consumers


